SpreadsheetBench: Towards Challenging Real World Spreadsheet Manipulation
1Renmin University of China, 2Tsinghua University, 3Zhipu.AI
Evaluating LLM Agents' Capabilities in Manipulating Complex, Real-World Spreadsheets
SpreadsheetBench is a challenging spreadsheet manipulation benchmark that (1) contains 912 questions exclusively derived from real-world scenarios, (2) includes spreadsheet files with tabular data in various formats, (3) features a more reliable evaluation metric akin to online judge platforms.
Key Features
-
1. Real-World Questions: Built from 912 authentic user questions sourced from online Excel forums, reflecting genuine and complex spreadsheet manipulation needs.
2. Diverse Spreadsheets: Includes real spreadsheets with intricate structures such as multiple tables, non-standard relational layouts, and abundant non-textual elements, mirroring actual user environments.
3. Robust Evaluation: Introduces a reliable, online-judge-style evaluation metric using multiple test-case spreadsheets per instruction to assess the generalization and robustness of model-generated solutions.
Evaluation Metrics
Overall (Pass@1): The overall accuracy across all 912 questions and 2,729 spreadsheets.
Benchmark Statistics
SpreadsheetBench incorporates complex questions based on real-world scenarios and diverse types of tables in spreadsheet files, compared to previous benchmarks. We present four data examples in SpreadsheetBench to illustrate the attributes of real-world problems and the challenging nature of our benchmark.
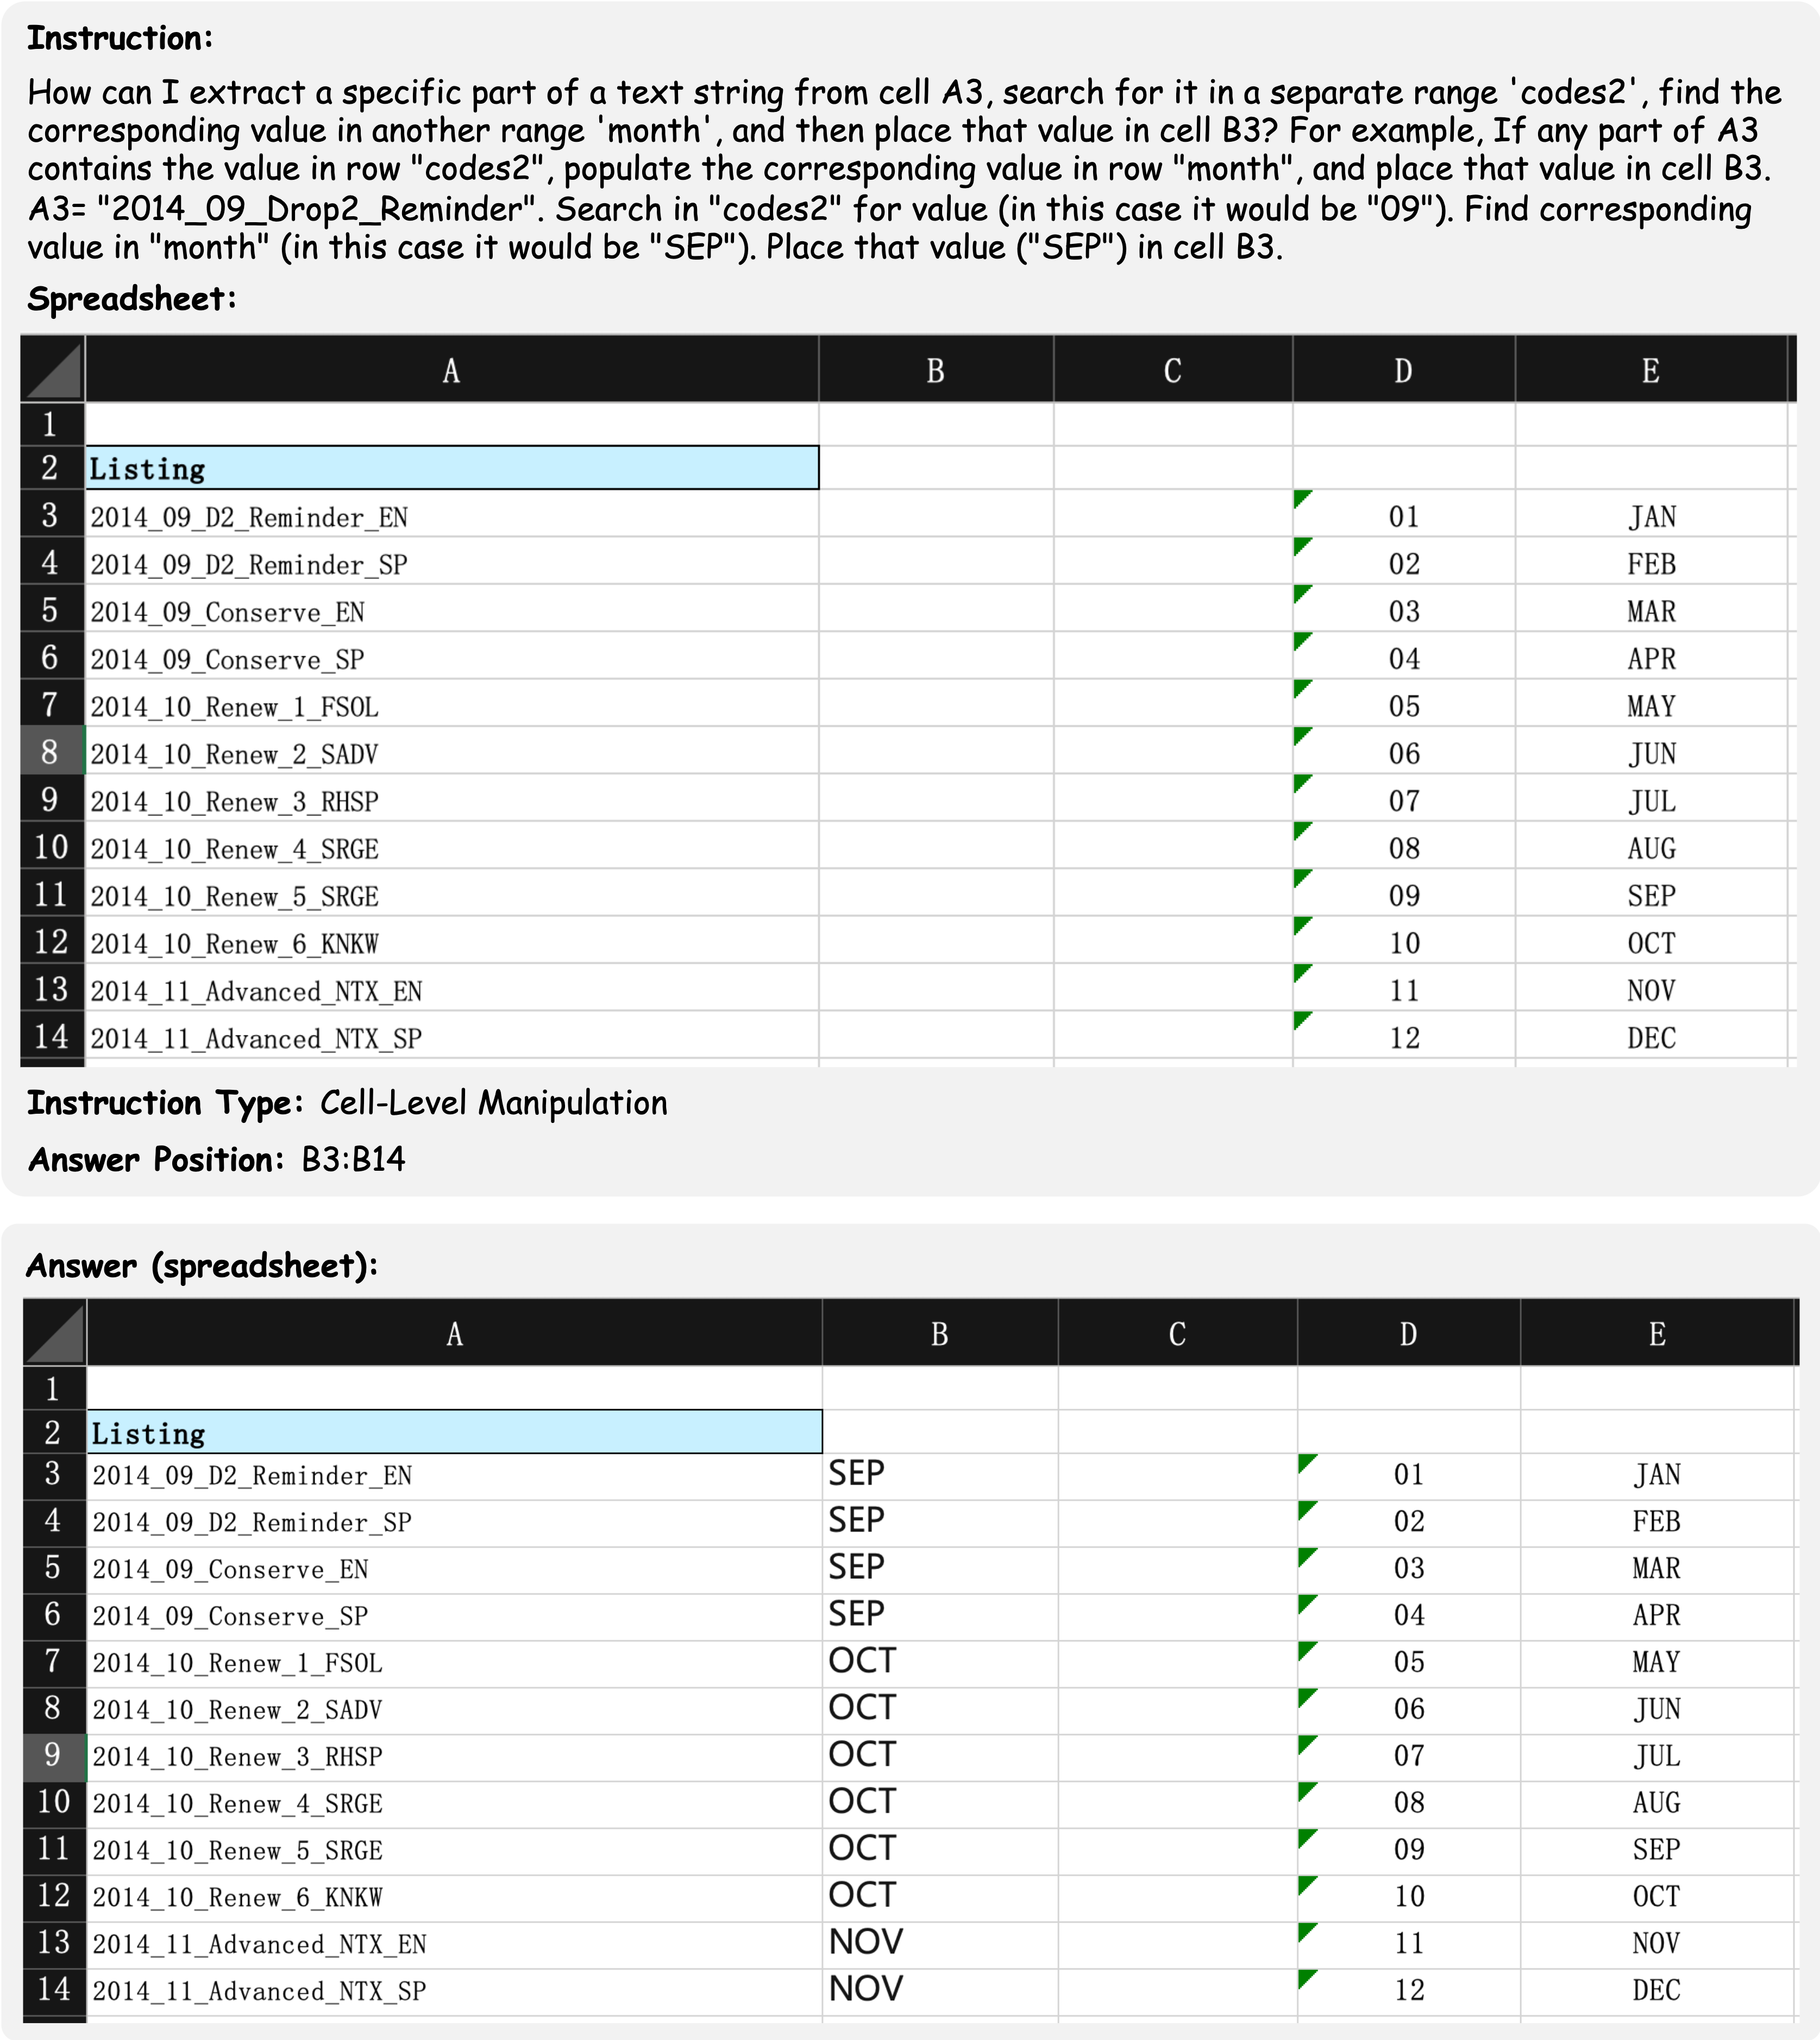
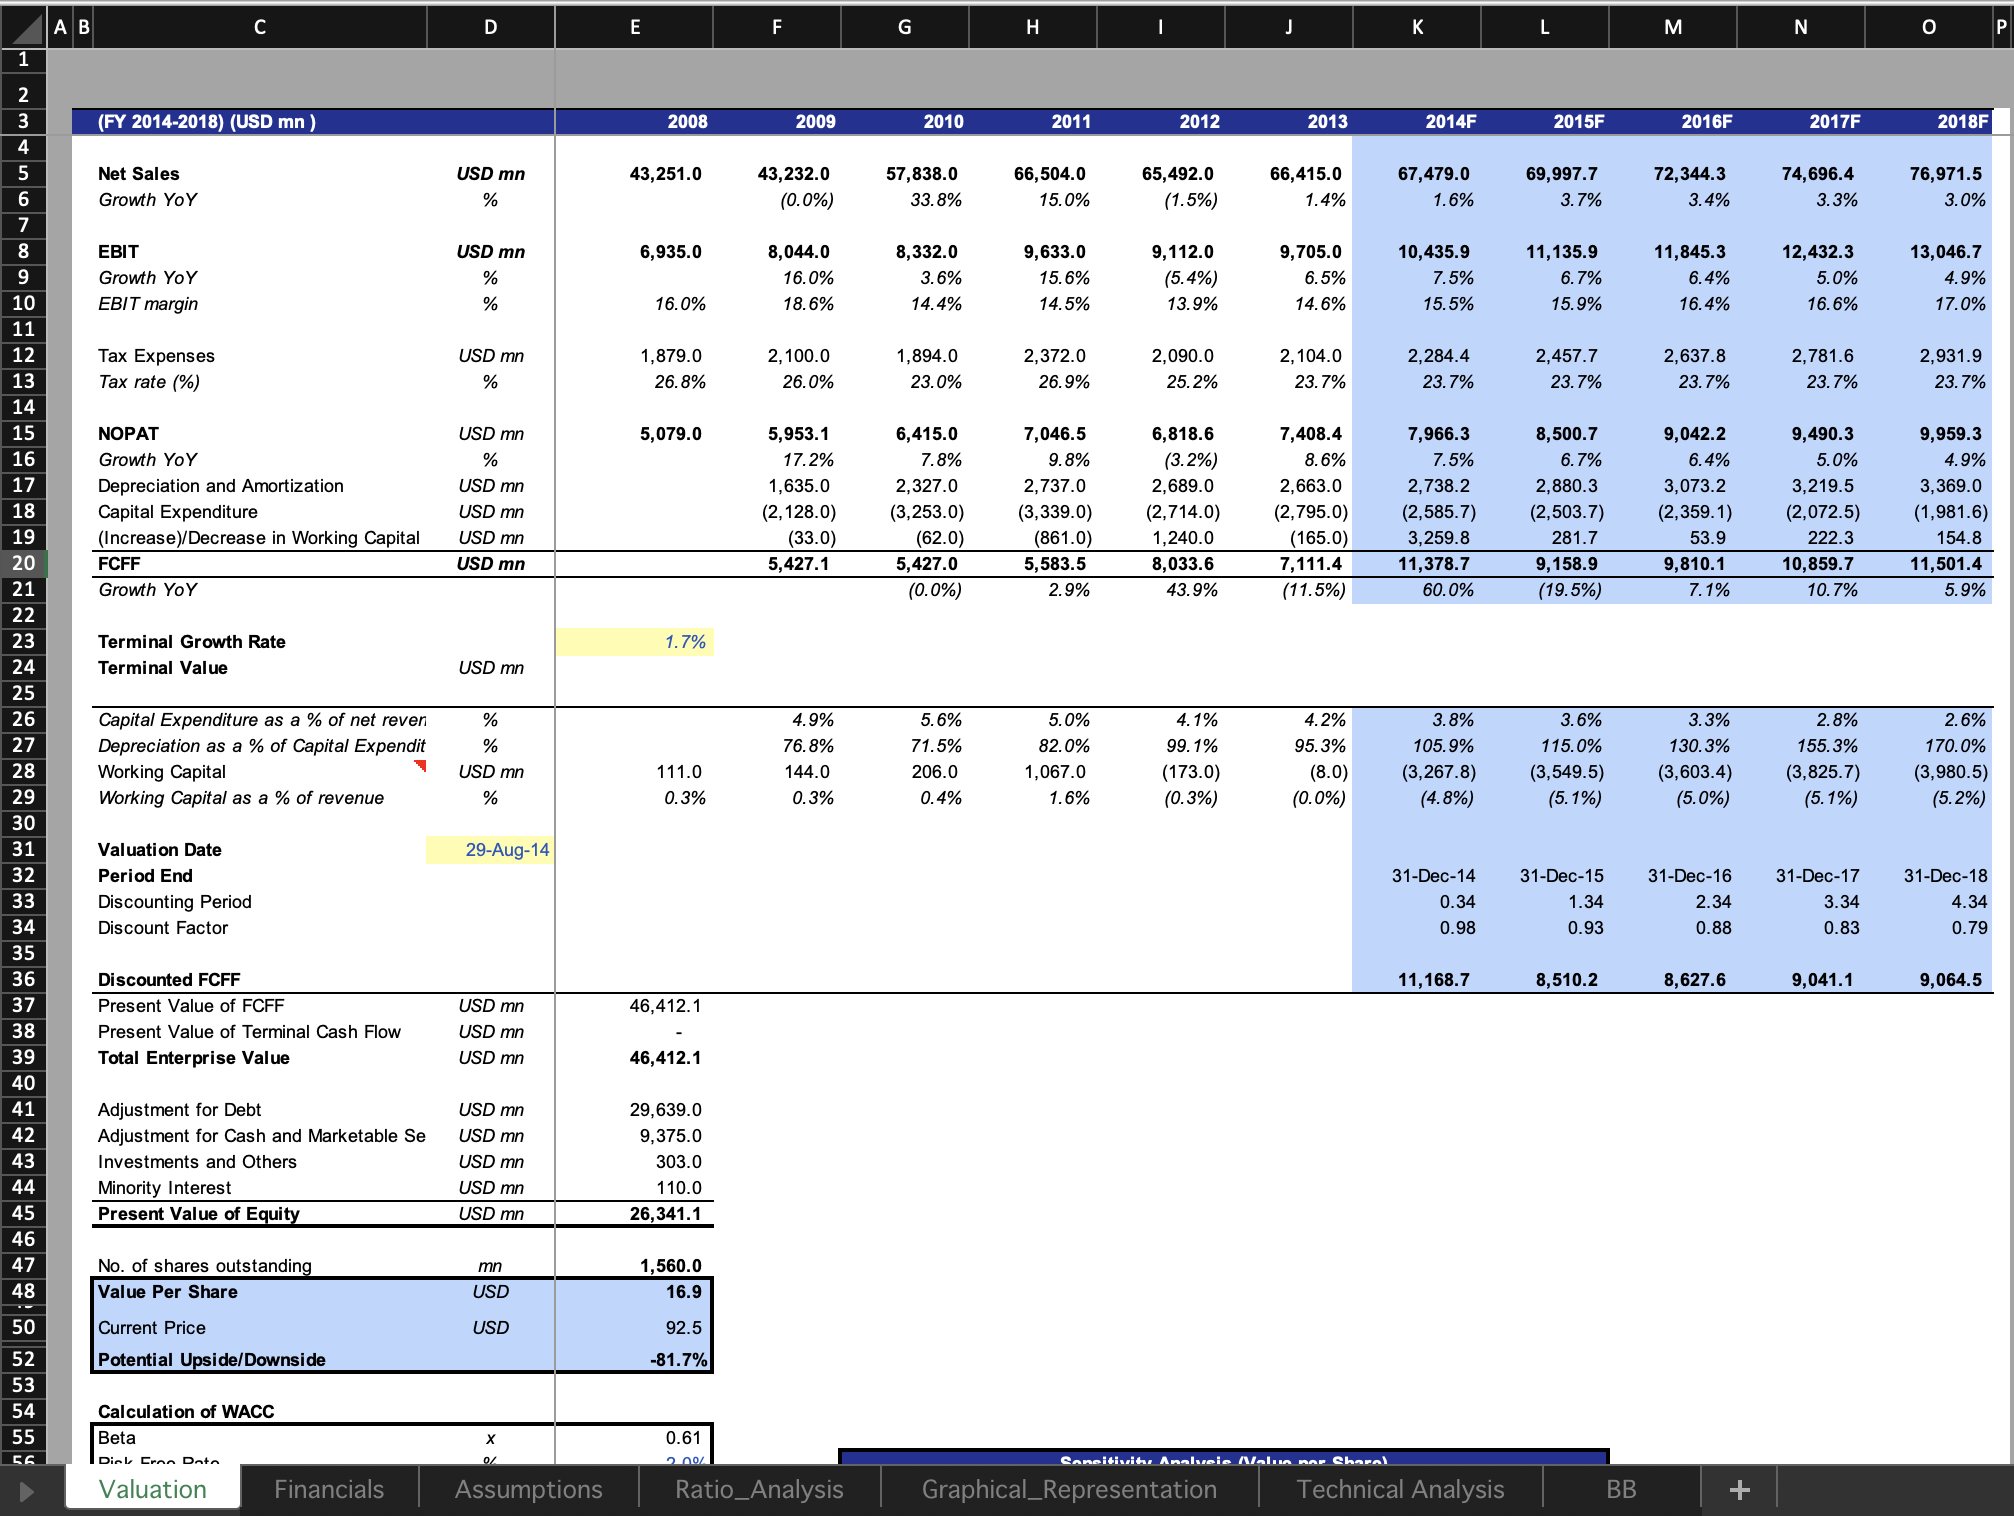
Example 1: A cell-level manipulation example question involves manipulating a non-standard relational table (missing header on column D and column E).
This example shows a cell-level manipulation data example which aims to extract a specific part of a text string from a column of cells. The instruction contains the demand of the user and an example manipulating action of the question, which rarely occur in synthetic instructions of the previous benchmarks. Furthermore, the table within the spreadsheet file is a non-standard relational table that lacks a complete table header. The final result is required to be filled in the cells from B3 to B14, which ensure the uniqueness of the answer.